To
access this dialog:
In the Project Pane,
double-click Event Log.
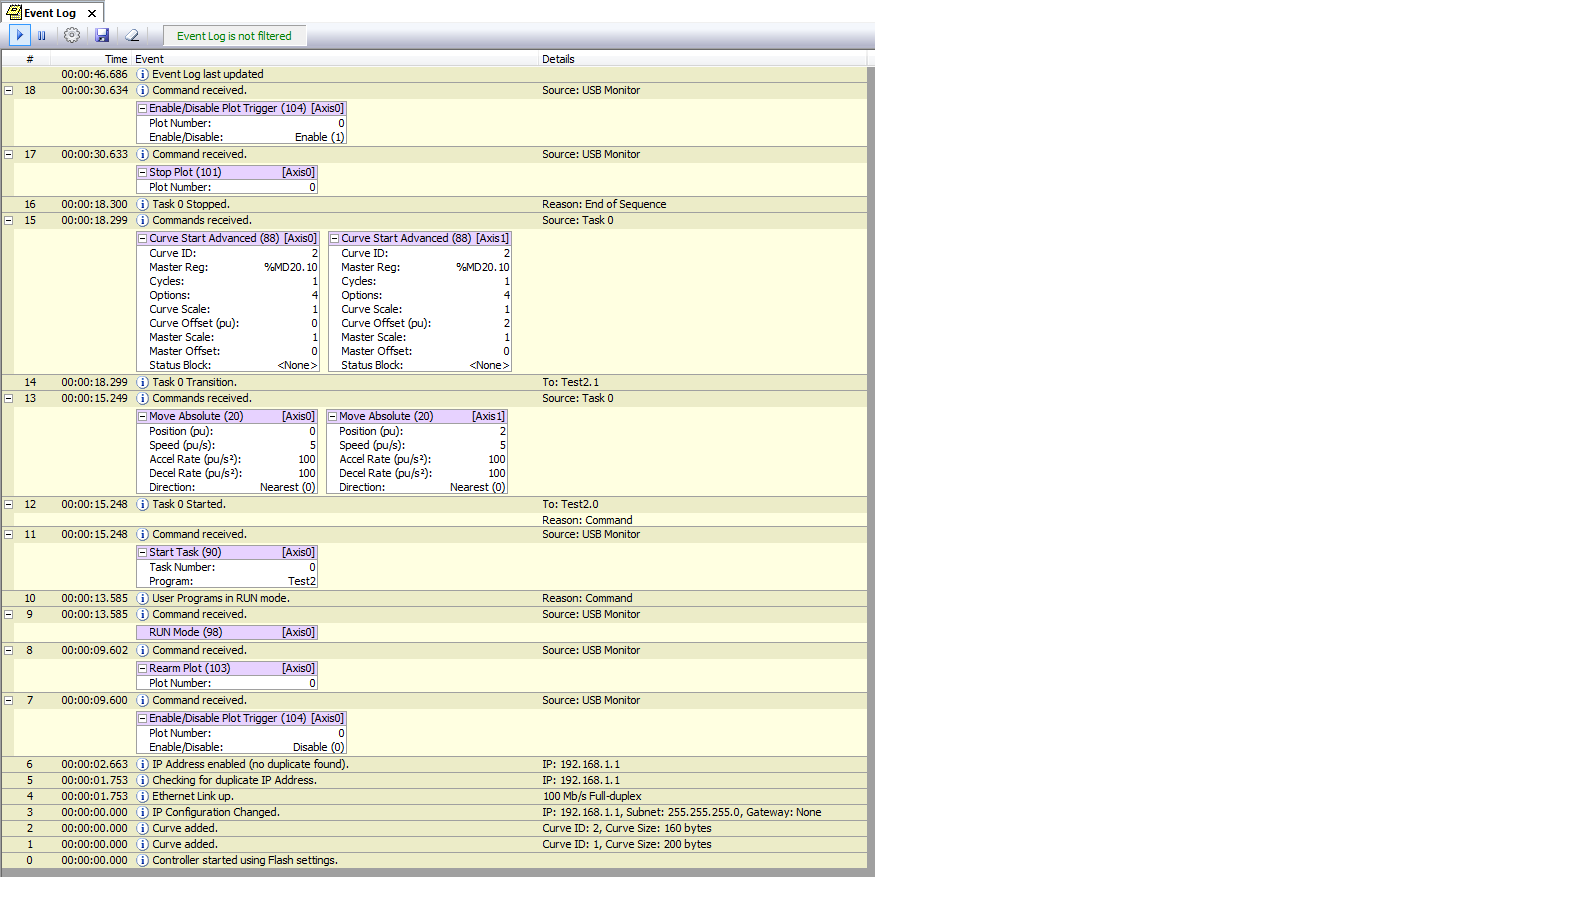
The Event Log Monitor is one of your most important troubleshooting tools. The Event Log Monitor displays all events that have occurred in the controller, such as issued commands, changed parameters and errors. The Event Log Monitor is an important aid in troubleshooting. It can be used to:
Determine whether a command was successfully issued. The entire command, with parameters, is displayed.
Find out which, if any, error occurred.
Determine where a command was issued from, for example, from a PLC, from a User Program, from the Command Tool.
Each entry in the Event Log Monitor has the following components:
|
Component |
Description |
|
# |
The number is solely for indicating the order of the events. |
|
Time |
The time the event occurred is given in the following format: dayd hour:minute:second:millisecond
The time is measured from when the RMC was last powered up, and is not a precise time. For troubleshooting, this same time can be displayed in plots and is useful in matching events with the plot data. In the Plot Manager, on the View menu, choose Show Absolute Time. The Plot Detail window will include the absolute time of the cursor in the currently displayed plot. |
|
Event |
Describes the type of event. |
|
Details |
Provides additional details on the event, such as the previous and changed values, command source, etc |
Number of Entries
The maximum number of Event Log entries is listed below. The Event Log itself is in the RMC. The Event Log Monitor simply displays the RMC's Event Log. On the RMC75E, RMC150E and RMC200, the Event Log will hold up to 8192 entries. When the maximum number of entries is reached, the oldest entries will disappear.
On the RMC75P and RMC75S, the Event Log is limited to the lesser of 512 entries or 2048 total words. When the maximum number of entries is reached, the oldest entries will disappear. Notice that if the Event Log Monitor is open and online with the RMC, it will store up to 8192 entries, even though the RMC75P and RMC75S store less.
Clearing the Event Log
To clear the Event Log, click the Clear
Event Log ![]() button on the toolbar
in the Event Log window. This will remove all the entries from the Event
Log.
button on the toolbar
in the Event Log window. This will remove all the entries from the Event
Log.
Saving the Event Log
To save the Event Log, click the Save
Event Log ![]() button on the toolbar
in the Event Log window. A Save As dialog will open. Drowse to a folder,
enter a filename and click Save.
The sEvent Log will be saved with the file extension "rmcelog".
button on the toolbar
in the Event Log window. A Save As dialog will open. Drowse to a folder,
enter a filename and click Save.
The sEvent Log will be saved with the file extension "rmcelog".
Pausing the Event Log Monitor
To Pause the Event Log Monitor, click the Pause Event Log ![]() button on the toolbar in the Event Log window. The Event Log Monitor will
stop uploading new Event Log items, although the Event Log in the RMC
is still logging. When the Event Log Monitor is paused, it will also try
to backfill any missing items as much as possible. Because the Event Log
is finite, the Event Log Monitor may not be able to backfill all its missing
data.
button on the toolbar in the Event Log window. The Event Log Monitor will
stop uploading new Event Log items, although the Event Log in the RMC
is still logging. When the Event Log Monitor is paused, it will also try
to backfill any missing items as much as possible. Because the Event Log
is finite, the Event Log Monitor may not be able to backfill all its missing
data.
Pausing the Event Log
To pause the Event Log itself in the RMC, and not just the Event Log Monitor, use the Pause/Resume Log (95) command. This is useful for advanced troubleshooting.
Resuming the Event Log and Event Log Monitor
To Resume the Event Log in the RMC, and the
Event Log Monitor in RMCTools, click the Resume
Event Log ![]() button on the toolbar
in the Event Log window. The Event Log will start running, and the Event
Log Monitor will resume uploading new Event Log items.
button on the toolbar
in the Event Log window. The Event Log will start running, and the Event
Log Monitor will resume uploading new Event Log items.
Opening a Saved Event Log File
A saved Event Log file can be opened in the following ways:
In the Project Pane, right-click Event Log and choose Open Event Log File. Browse to the file and click Open.
On the File menu, choose Open. In the Open dialog, in the Files of Type box, choose RMCToolsEvent Log Files (*.rmcelog). Browse to the file and click Open.
The file you select will be opened in a new Event Log window. The new Event Log window will not record new data from any RMC.
Filtering the Event Log
Many of the events in the Event Log can be filtered out. This is useful when looking for a particular event while many other events are occurring, making it difficult to find that particular event. Or, certain events can be added, such as communication transactions.
To change the filter configuration, on the Event
Log toolbar, click the Event Log Properties button. The Event Log Properties
dialog will open. In the tree on the left, select an object. To exclude
an event for that object, clear the check box. When finished, click OK.
button. The Event Log Properties
dialog will open. In the tree on the left, select an object. To exclude
an event for that object, clear the check box. When finished, click OK.
User-Defined Event Log Entries
For troubleshooting of advanced user programs, you can create your own custom Event Log entries. Use the LOG_EVENT() function in an Expression (113) command in a user program. This function will cause values of its three function parameters to be reported in the Event Log.
See the Functions topic for details.
Example Event Log
See Also
Troubleshooting Overview | Event Log Properties
Copyright © 2026 Delta Computer Systems, Inc. dba Delta Motion