An XY plot displays all the data items in a plot relative to any other data item in the plot, with that other data item being the horizontal (x) axis, and the remaining data items being plotted on the vertical (y) axis. An XY plot requires that a data item in the plot be set as the X axis. If a plot does not have an X Axis item, then the plot data items will be displayed versus time, with the time as the horizontal (x) axis.
XY plots only apply to how the plot is viewed in the Plot Manager. The underlying data is still stored in the same form as a typical time-based plot; that is, the data is stored as samples captured at each plot sample interval. An uploaded XY plot can be easily be viewed as a time-based plot, and a time-based plot can easily be viewed as an XY plot. Any data item in any plot can be selected to be the X-axis value.
Defining an XY Plot Template
To define a plot template as an XY plot:
In a plot template, choose Custom.
In the XY plot section, check the XY Plot check box.
In the X Axis box, select the plot item to be the x axis (horizontal) value in the plot.
The x-axis scale of the plot will default to be automatic, meaning that the plot will scale horizontally to fit the contents. If you wish to set a fixed scale value, check the Manual Scale box and enter the desired range.
After applying the changes, every plot uploaded by this template will be displayed as an XY plot.
Notice that the X-axis item may still be plotted (and will appear as a diagonal line on the plot). This is controlled by checking or unchecking the Graph box for the item in the Plotted Data Items table.
Using the XY Time Slider
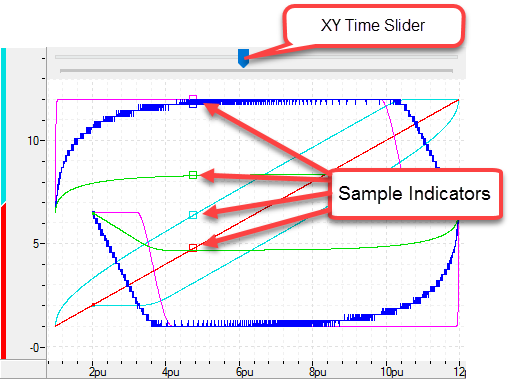
The XY Time Slider in the Plot Manager is very useful for tracking the progression of an uploaded plot in time, or determining the exact values of the data at a specific point in time.
The XY Time Slider is located at the top of an uploaded plot. It covers the entire time duration of the plot. When the slider is clicked or dragged with the mouse, the Sample Indicator boxes will show the data points for that given point of time in the plot. In the Plot Details window, the Data Values column will show the values of the data points, as well as the time.
Using the Cursors
The cursors are useful for approximating the values of the data items at some location in the plot and making measurement in the plots. The Plot Details window will display the value of a cursor relative to the scales for each data item. It will not display the exact values of the data items, since exact data values do not exist for every location in the plot (to view exact data values, use the XY Time Slider). In the Plot Details window, the x-axis values of the cursors will be given by the X Axis item, and the other items will list their respective y values.
How to:
Place a cursor:
Click anywhere in the plot. In the Plot Details window, the Cursor Value column will display the cursor values.
Place a second cursor:
Right-click anywhere in the plot and choose Show 2nd XY Cursor. In the Plot Details window, the Cursor 1 and Cursor 2 columns will display the cursor values, and the Diff column will display the difference between the values.
Move a cursor:
Click a cursor and drag it. The data values in the Plot Details window will update as the cursor is moved.
Hide the cursors:
Right-click anywhere in the plot and choose Hide XY Cursors.
Hide only the second cursor:
Right-click anywhere in the plot and choose Hide 2nd XY Cursor.
Switching Between XY and Time
An uploaded XY plot can be viewed as a time-based plot, and an uploaded time-based plot can be viewed as an XY plot.
How to:
Change an XY plot to a time-based plot:
Right-click anywhere in the plot and choose Convert to Time Plot.
Or:
In the Plot Details window, right-click the item labeled X Axis and choose Remove as X Axis.
Change a time-based plot to an XY plot:
Right-click anywhere in the plot and choose Convert to XY Plot. In the X-Axis box, choose the item that you wish to be the X axis and click OK.
Or:
In the Plot Details window, right-click the item that you wish to be the X axis and choose Set as X Axis.
Changing the X-Axis in an XY Plot
To change the x-axis item in an uploaded XY plot:
In the Plot Details window, right-click the item that you wish to be the X axis and choose Set as X Axis.
Changing the Scale in an XY Plot
The X-axis item of the plot is listed in the Plot Details window, and has two scales: x-axis and y-axis. Setting the y-axis scale of the X-axis item (if the x-axis item is being plotted vertically as well) is the same procedure as for the other data items in the plot: right-click the item and choose Set Scale.
To change the x-axis scale in an XY plot:
In the Plot Details window, right-click the item labeled X Axis and choose Set X Axis Scale.
Choose Auto Scale or Manual Scale.
The Auto Scale option will scale the plot horizontally to fit the contents of the plot. The Manual Scale option will set a fixed scale. You can zoom in from the fixed scale.
Zooming an XY Plot
|
|
Mouse |
Keyboard |
Toolbar |
|
Horizontal Zoom |
Ctrl+Mouse Wheel |
Ctrl+Plus Sign Ctrl+Minus Sign |
|
|
Horizontal Scroll |
Shift+Mouse Wheel |
- |
- |
|
Horizontal Reset1,2 |
- |
- |
|
|
Vertical Zoom |
Ctrl+Shift+Mouse Wheel |
Ctrl+Shift+Plus Sign Ctrl+Shift+Minus Sign |
|
|
Vertical Scroll |
Mouse Wheel |
- |
- |
|
Vertical Reset1 |
- |
- |
|
|
Zoom to Window2 |
- |
- |
|
1 Resets auto-scaled items to fit the data. For manually scaled items, resets the scale to the manual setting.
2 For manually scaled items, resets the scale to the manual setting. Manually setting the horizontal scale will set the maximum horizontal zoom for the plot. If the manual scale does not show all of the plot, you must change the scale in order to see the entire plot.
See Also
Plot Manager Overview | Using Custom Plots
Copyright © 2026 Delta Computer Systems, Inc. dba Delta Motion


